Digital Advertising Google Search Ads: A Weekly Optimization Guide

9-step checklist for optimizing Google Search Ads
It’s enough of a challenge to set up a great Google Ads campaign. It’s another challenge altogether to keep that campaign in tip top shape, and constantly improving. This guide is intended to help you with that. It offers a practical guide on what to examine each week, and the types of changes that will constantly improve your results.
Here is the 9-step checklist for what you should be looking at each week in your Google Search Ads campaigns:
-
Overview
-
Recommendations
-
Budget
-
Search Terms
-
Keywords
-
Ads
-
Demographics
-
Devices
-
Locations
Overview
I look at the Overview screen each week to check for the following:
-
Problems. Are my ads delivering? Did they stop at some point? I want to be able to spot any issues so that I can dig into them, if necessary.
-
Trends. Am I on an upward or downward trend when it comes to spend? Cost per click? Clickthrough rate?
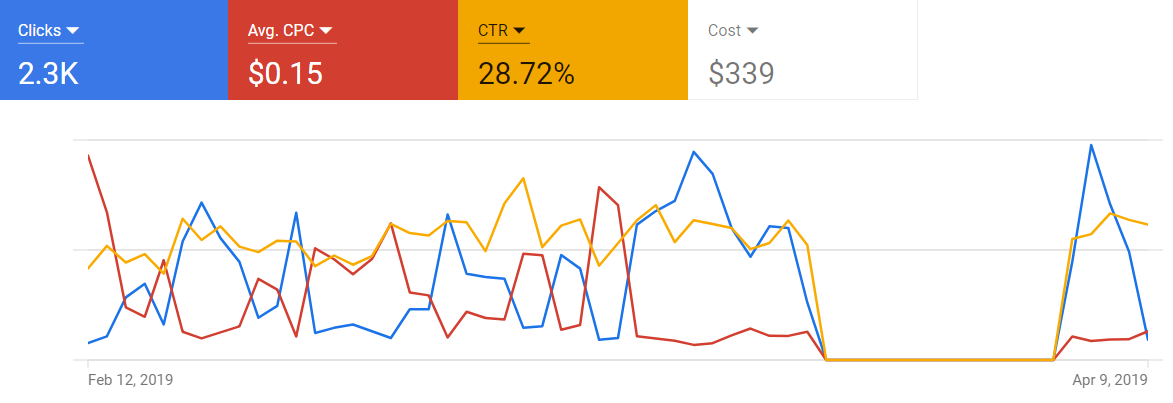
Make sure your campaign is spending properly, and identify any gaps or trends.
In the screenshot above I can see the following:
-
There was an outage in late March. Was this planned? Was it an error?
-
My clickthrough rate has been fairly steady over time.
-
My cost per click seems to be all over the map, but recently it’s been low.
-
My clicks seem to follow a weekly cycle, and they’ve recently started increasing.
Recommendations
The Google Ads platform offers up suggestions for improving your results, which is nice. These tips can be very helpful. I like to examine them each week to see if there’s anything that I wouldn’t have thought of myself.
I find that Google is particularly helpful at offering up new ad types to create, suggestions on breaking out your keywords into new ad groups, and adjusting budgets.
Budget
Each week I want to take a look at the budgets for each of my campaigns. I want to ensure that I’m spending properly; not too low, not too high. I also examine the high level performance of my campaigns to see if I should shift budget from a poor performer to a top performer.
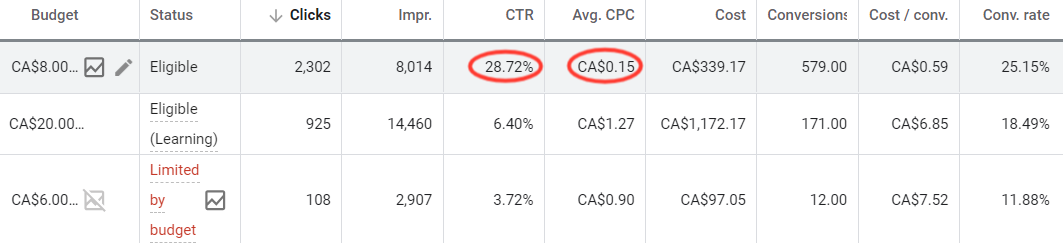
Analyzing budgets in Google Ads
In the chart above, I see the following:
-
The first campaign is far away my top performer. Most clicks, highest CTR, lowest CPC, highest conversions, etc. Yet, it only has an $8/day budget when compared to the second campaign with $20/day. As it turns out, the first campaign is for ‘branded’ search terms, so we expect this. We funnel more money to the second campaign as the terms are of a more ‘discovery’ nature, which helps to bring in new customers.
-
Google is suggesting I add more money into the third campaign. It’s not performing nearly as well as the second campaign, however, so I will ignore that message.
-
The roll up budget for all of my search campaigns is $34/day. At 30.4 days per month, that works out to $1,033/month. Is that where I want to be?
Search Terms
This screen is accessed by clicking on the ‘Keywords’ link down the left, and then clicking the ‘Search Terms’ tab along the top. It’s arguably one of the most valuable pieces of insight you can glean from Google Ads. It shows you the actual searches that triggered your ads to display. I find this information particularly valuable for:
-
finding new keyword opportunities, and
-
finding bad searches that I can add as ‘negatives’.
Here’s a snapshot of some search terms for my own personal Google Ads account:
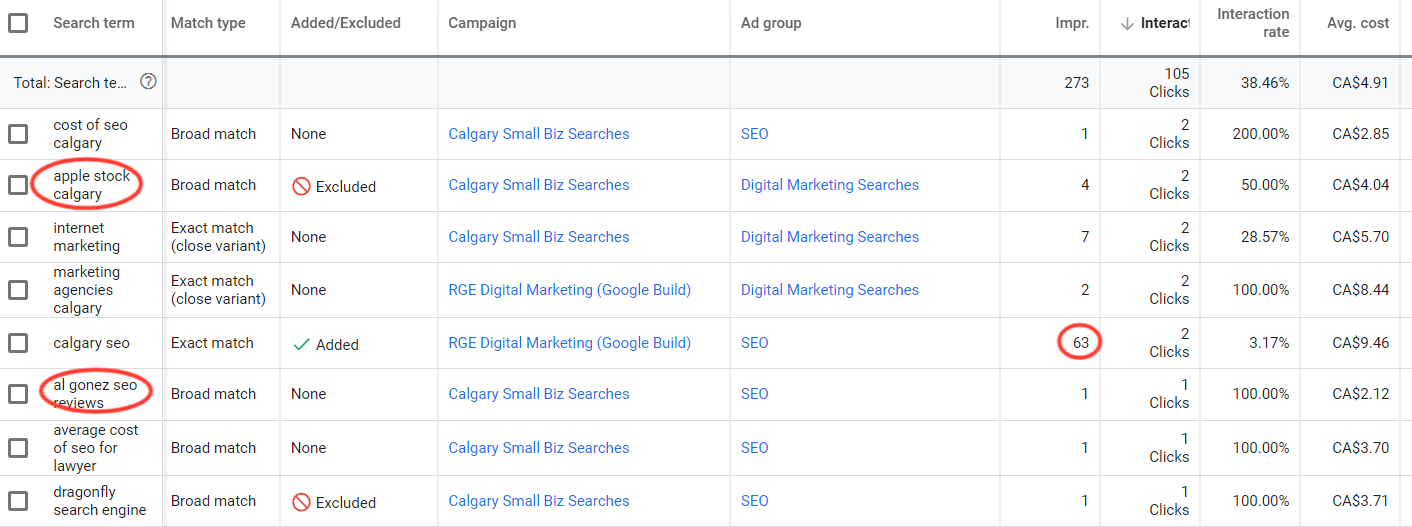
Take a look at the search terms that are actually triggering your ads to display, and driving clicks.
Opportunities:
-
I can see that the search “Calgary seo” triggered my ad a lot (63 times) but only resulted in 2 clicks. I can also see that the cost per click was $9.46. So there’s opportunity there for me to capture more clicks, but am I prepared to pay that high cost?
Negatives:
-
The second search in the list is “apple stock Calgary”. Clearly that has nothing to do with me or my services, so I will add the word “apple” as a negative keyword so it doesn’t trigger my ads again.
-
I also see “al gonez seo reviews”. I don’t know who Al Gonez is, but if someone’s searching for him, they’re probably not interested in me. So I will add “al gonez” as a negative keyword.
Keywords
This is where I examine the performance of my keywords. I’m looking to identify the top performers and the worst performers.
Top performers might get more money, and they might get split out into their own ad group.
Poor performers might get paused. Or, if I spot a theme among the poor performers, I might break them out into a new ad group. Sometimes doing this will allow you to write ad copy more specific to those terms, thereby improving their performance.
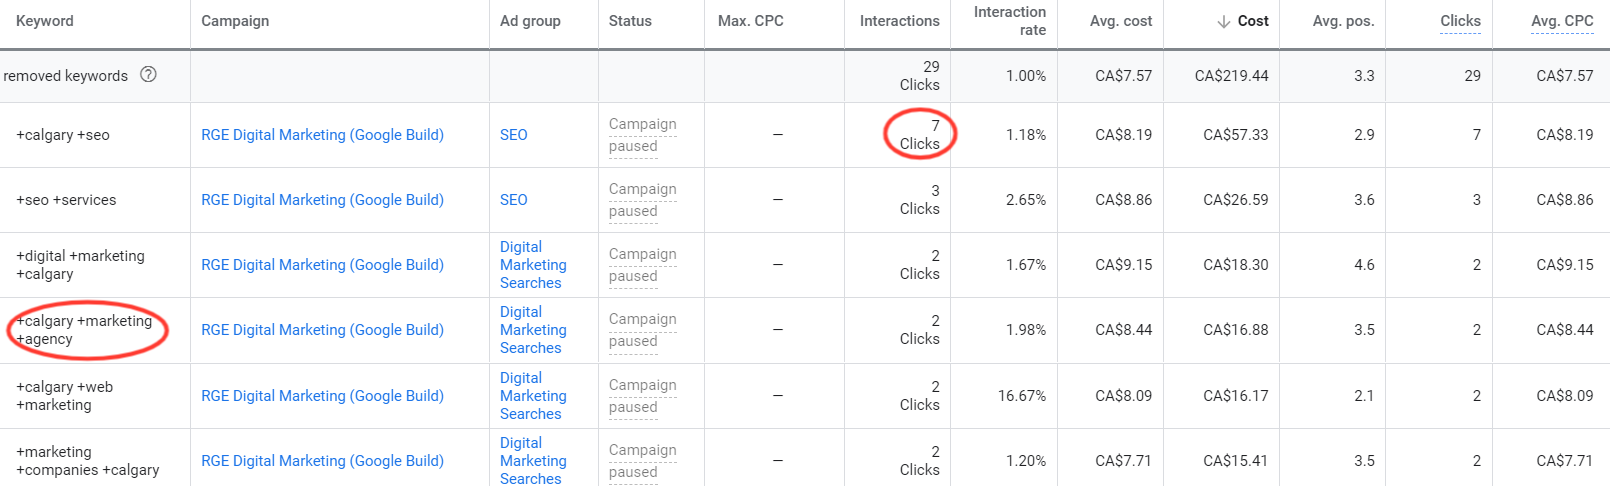
Which keywords are your top performers?
In the table above, here’s what I see:
-
My search term +calgary +seo is driving the most clicks. It has relatively good purchase intent, which is nice. It’s pretty expensive at $8.19 per click. My position is around third, so I could consider dropping my bid a little bit. That might push me down to a position of 3.5 or so, but it might lower my CPC. Alternatively, I could lean into this term and increase the bid to try to get in the top two spots.
-
I see the keyword +calgary +marketing +agency in there. It’s pretty expensive at $8.44 per click. Given that I only do digital advertising and SEO, should I really be targeting this term? People searching for it might be looking for a more full service agency.
When I sort the keyword list on Average CPC, cheapest first, I see something interesting:
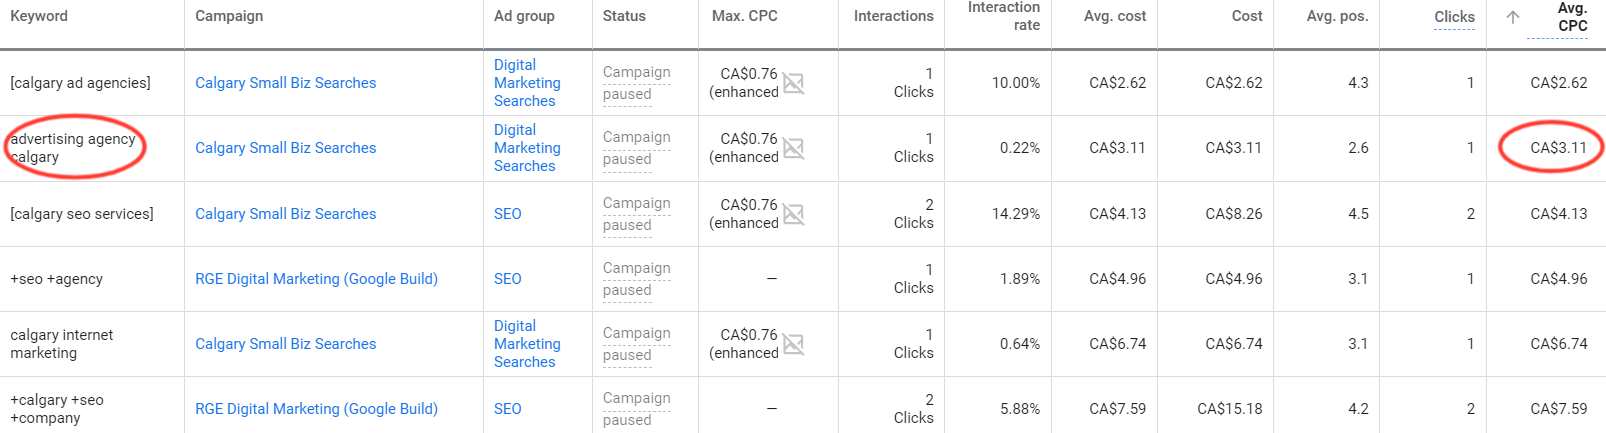
Can you spot any keyword opportunities?
-
The term “advertising agency calgary” has the second lowest CPC. I’m also able to be in position 2.6, which is nice. Now I’m not an agency, per se (it’s just me!) but the intent of someone searching for an advertising agency in my home town is a pretty good match for me. I may be able to get in front of them and tell them all about my expertise with Google, Facebook and programmatic advertising.
-
This could be a good opportunity, so I might increase my bid for this, ensure it has really specific ad copy to support it, and ensure I’m sending the visitor to a really good landing page.
Ads
When I examine ads, I want to look for winners, losers and opportunities. Which ads are bringing me the most clicks for the lowest price? Are the clickthrough rates above Google’s stated benchmark of 6.2%? Is there room to improve the quality score of the ads?
Whenever I look at ads, I always ensure that I’m looking within a single ad group. This ensures that I’m comparing apples to apples.
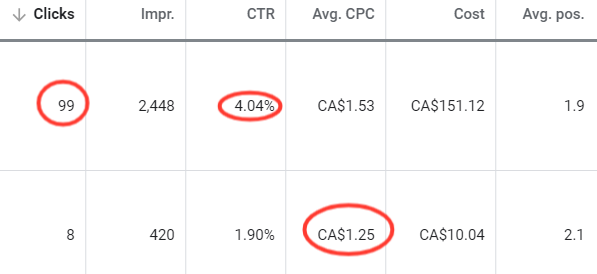
Identify your top performing ads.
What I see in the table above:
-
The first ad here appears to be the winner. It has the most clicks and the highest clickthrough rate. That said, the second ad has a lower cost per click. This may be because the second ad is appearing in a slightly lower position, but that’s doubtful. It would appear as though Google is automatically optimizing to show the first ad more often.
-
I might consider adding in a third ad to this ad group. I would “copy and edit” the first ad, and then make variations to the copy to match the keywords in the ad group.
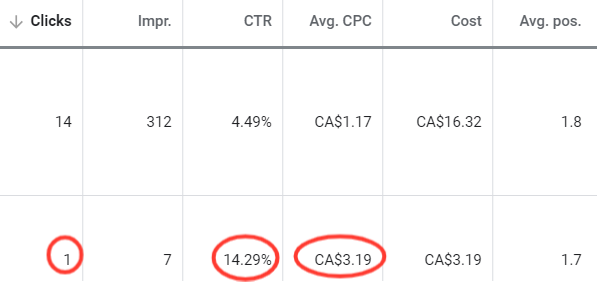
Be careful when making decisions with limited data.
In the table above, I notice that the clickthrough rate on the second ad is much higher than the first, at 14.3%. But before I get too excited about it, I notice two things:
-
The cost per click is much higher
-
There is only 1 click’s worth of data. This is not a statistically valid amount of data.
In this case, it’s best that I simply keep an eye on this ad group as it gathers more data.
I also want to ensure that I look into my ad extensions:
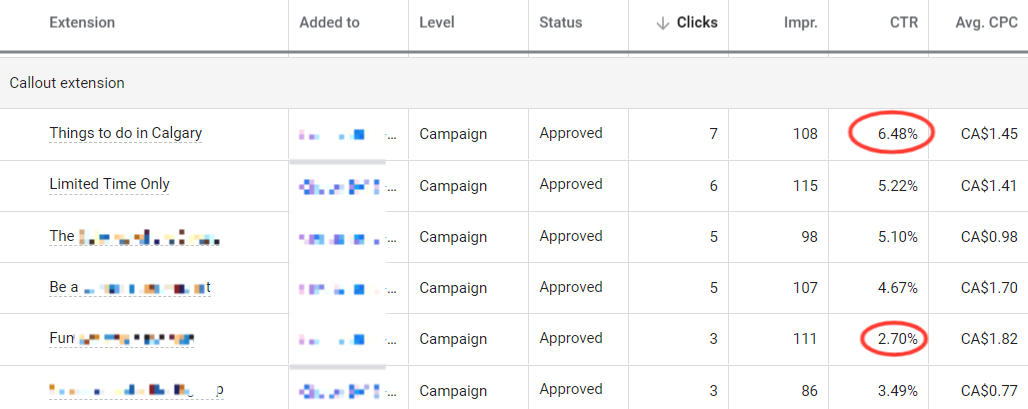
The table above shows my callout extensions, and how they performed. It looks like the first callout extension helps drive the most clicks to my ads. As such, I might want to focus in on the term “Things to do in Calgary”, and ensure that my keywords and ads focus on this.
Conversely, the fifth callout is driving the lowest clickthrough rate. Is there something wrong with it? Is it properly aligned with my campaign? I might consider swapping it out for a new callout extension in this instance.
Demographics
As with examining ads, be sure you’re only looking at a single ad group when you look at demographics.
The first demographic I look at is age:
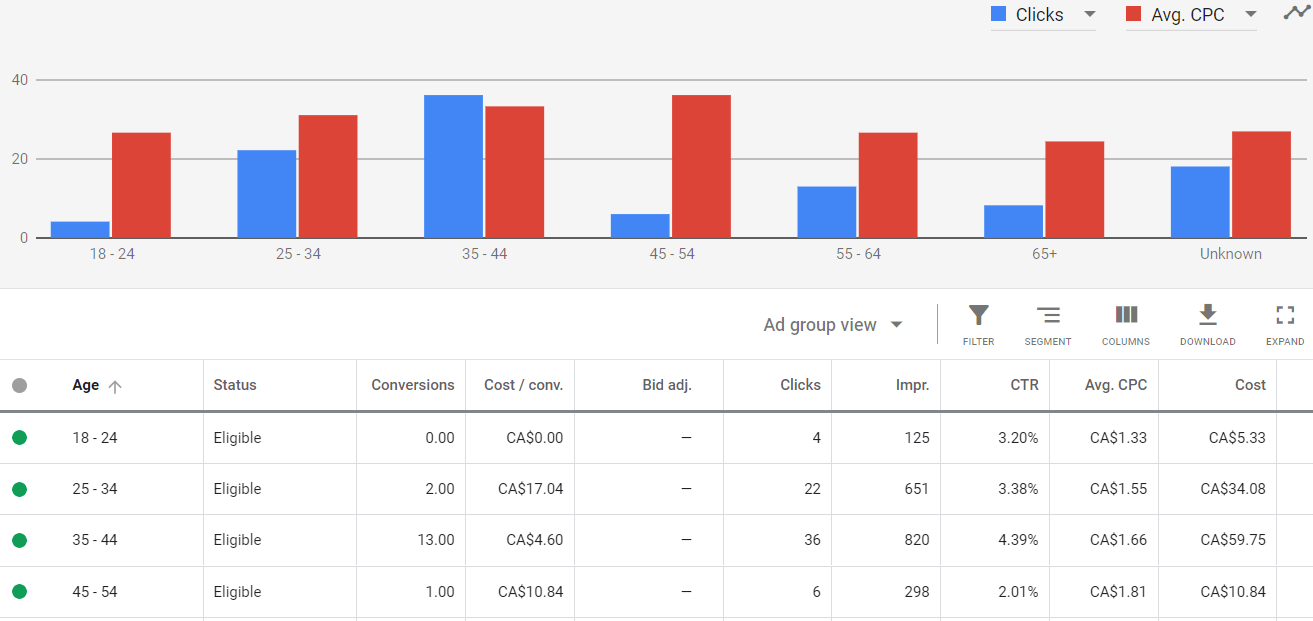
Which age groups are producing the best results?
In this particular case, I can see that the 35-44 age group is giving me the most clicks, followed by the 25-34 group. The costs per click are a little higher for these audiences, but I happen to know that they’re the folks we’re looking for.
I might actually decide to exclude the 18-24 group, as well as the 45-54 group. These are providing relatively few clicks for me. Not only that, but the 45-54 segment is my most expensive from a cost per click standpoint.
Now let’s look at gender:
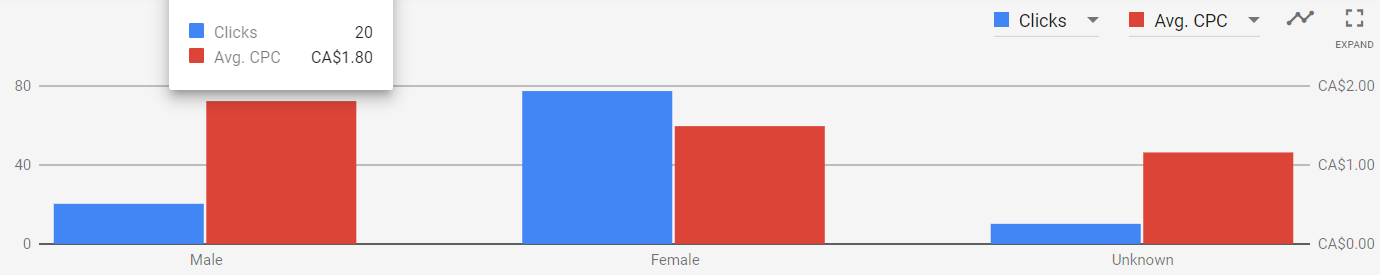
Do you notice any trends with the gender of your audience?
This chart shows me, quite clearly, that women are my top performers. Lots more clicks, and a lower cost per click. I might decide to exclude men altogether, or create a bid adjustment to pay less for them, or more for the female audience.
Devices
It’s important to see what type of devices people are using when they view and click on your ads.
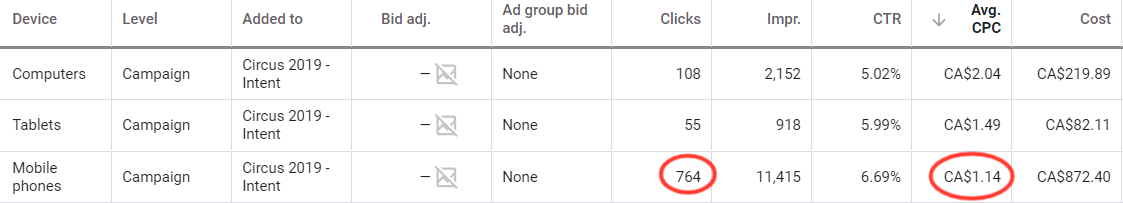
Are there certain device types that drive better results than others?
In the above table, I see the following:
-
The vast majority of my clicks are coming from mobile phones.
-
I’m getting the lowest cost per click and highest clickthrough rate on mobile phones.
-
Computers (i.e. laptops and desktops) is my poorest performing device category. Maybe I should exclude it altogether, or enter a bid adjustment that lowers what I’m willing to pay for those clicks.
Something else to consider is to ensure that my destination website is properly optimized for mobile. If 80% of my traffic is people on mobile phones, it sure better be!
Locations
Examine the locations for each ad group. See which are performing the best (e.g. lowest CPC, highest CTR, most conversions, etc.) and consider excluding poor performers, or making bid adjustments.
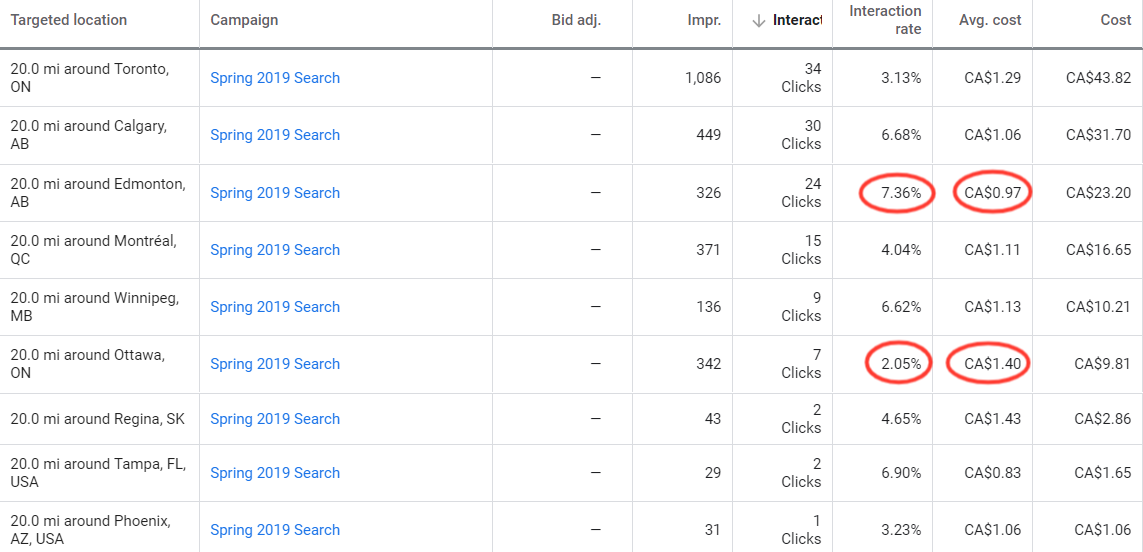
If you’re targeting multiple locations, find out which are performing better than others.
In the table above, I see the following:
-
Toronto is bringing me the most clicks. That said, it has a relatively low clickthrough rate, and a slightly higher cost per click.
-
The clickthrough rate is the highest for Edmonton. It’s also bringing me the second lowest cost per click. Perhaps Edmonton is a good target form me. I might consider creating a campaign dedicated to Edmonton, and adjusting my ad copy and keywords to focus on the city.
-
Ottawa is kind of sucking in the example above. It’s bringing me a decent amount of clicks, but they’re a bit more expensive. Not only that, but the clickthrough rate is pretty low. It might be time to drop Ottawa from the campaign.
In Summary
There are a lot more things you can look at when you optimize your Google Search Ads campaign. The trick is looking at the things above, but in different ways. Here are some additional tips:
-
Try sorting by different columns to see if you see something interesting.
-
Look for themes and trends over time. Are you moving in the right direction?
-
Make sure your decisions are only made with a sufficient amount of data. No sense freaking out of a single click that cost you 15 bucks.
-
Develop a regular cadence. I like once a week, but you might need or want to check more frequently. Heck, if your campaign is super small, once a month would probably suffice.
I hope you enjoyed this article, and happy optimizing!